Exploring Trichromacy through Maxwell's Color Experiment
by Koh Terai
with the guidance of Professor Brian Wandell for Psych 221: Image Systems Engineering at Stanford University
Last Updated: 19:30 Saturday, December 30, 2023 (PST)
We can create most of the colors we see daily using just three colors. For example, you may have heard of R, G, B — Red, Green, Blue — to express many colors. This understanding is fundamental to how we display color on monitors and how we print color.
But why three colors? Why not two or four or five? And how did humans discover that our eyes can "see" different colors by combining just three colors?
Today, this phenomenon is explained through the trichromatic theory, also known as the Young-Helmholtz theory, attributed to Thomas Young and Hermann von Helmholtz in the 19th century.
Less known to the development of trichromacy is another scientist —James Clerk Maxwell's contribution to the development of the theory.
In this piece, we explore the early experiments that led to the development of trichromacy through the less-celebrated, less-attributed James Clerk Maxwell's ingenious experiment to discover and prove the trichromatic theory.
Introducing the Apparatus
Our first step in retracing Maxwell's path is familiarize ourselves with the tool he created to conduct his experiment.
The tool consisted of a box around 6x3ft with a mirror, prisms, and lens, with a viewing hole to allow viewers to look inside the box.
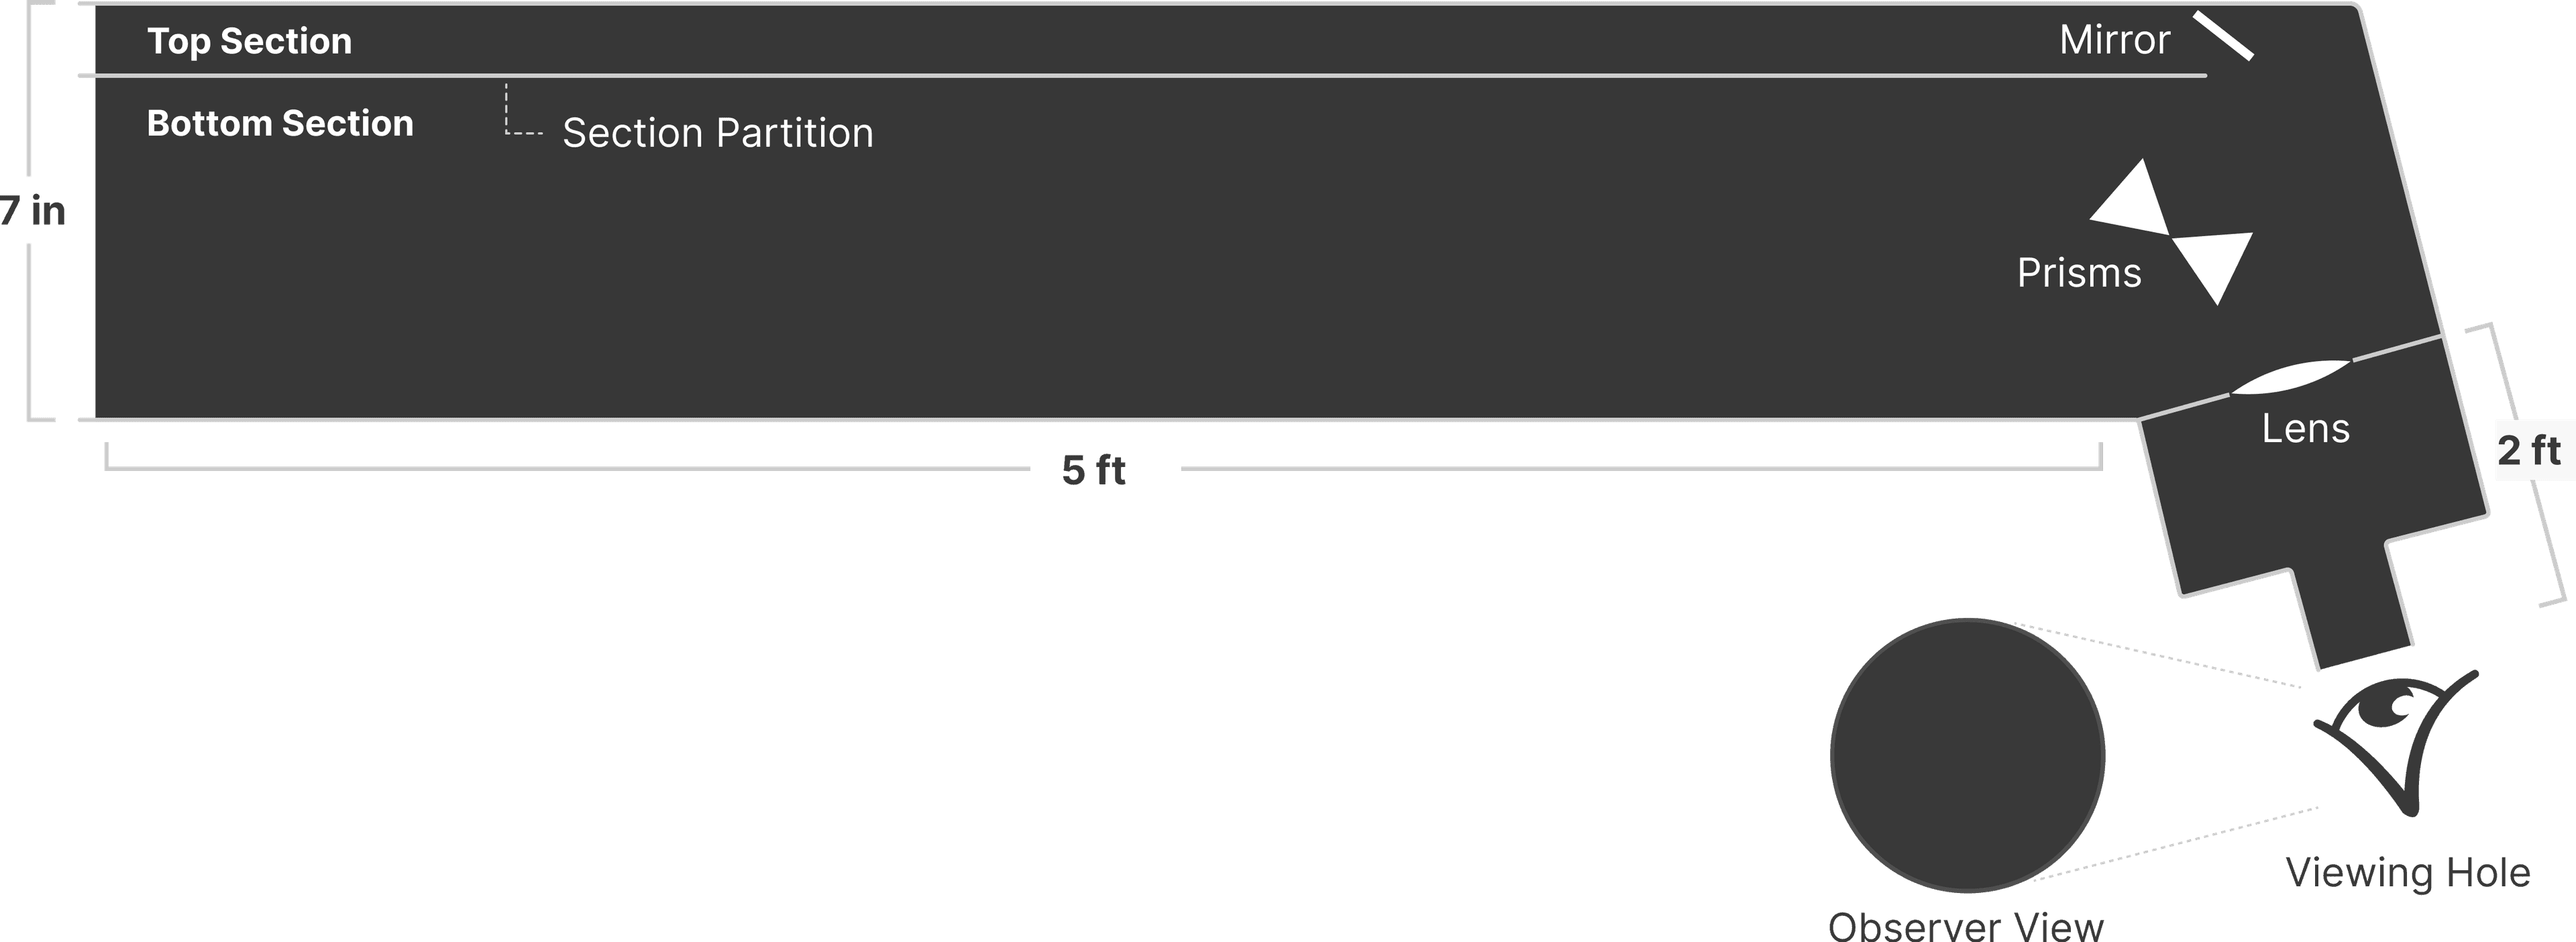
As a thought experiment, imagine shining a full spectrum of white light from the viewing hole at the bottom. The white light would be dispersed through the two prisms, creating a pure spectrum to the left, revealing all the wavelengths of visible light.

Now imagine that we create slits on the left side to cover up most of the pure spectrum other than a specific section. We would only see a particular spectrum region on the other end.

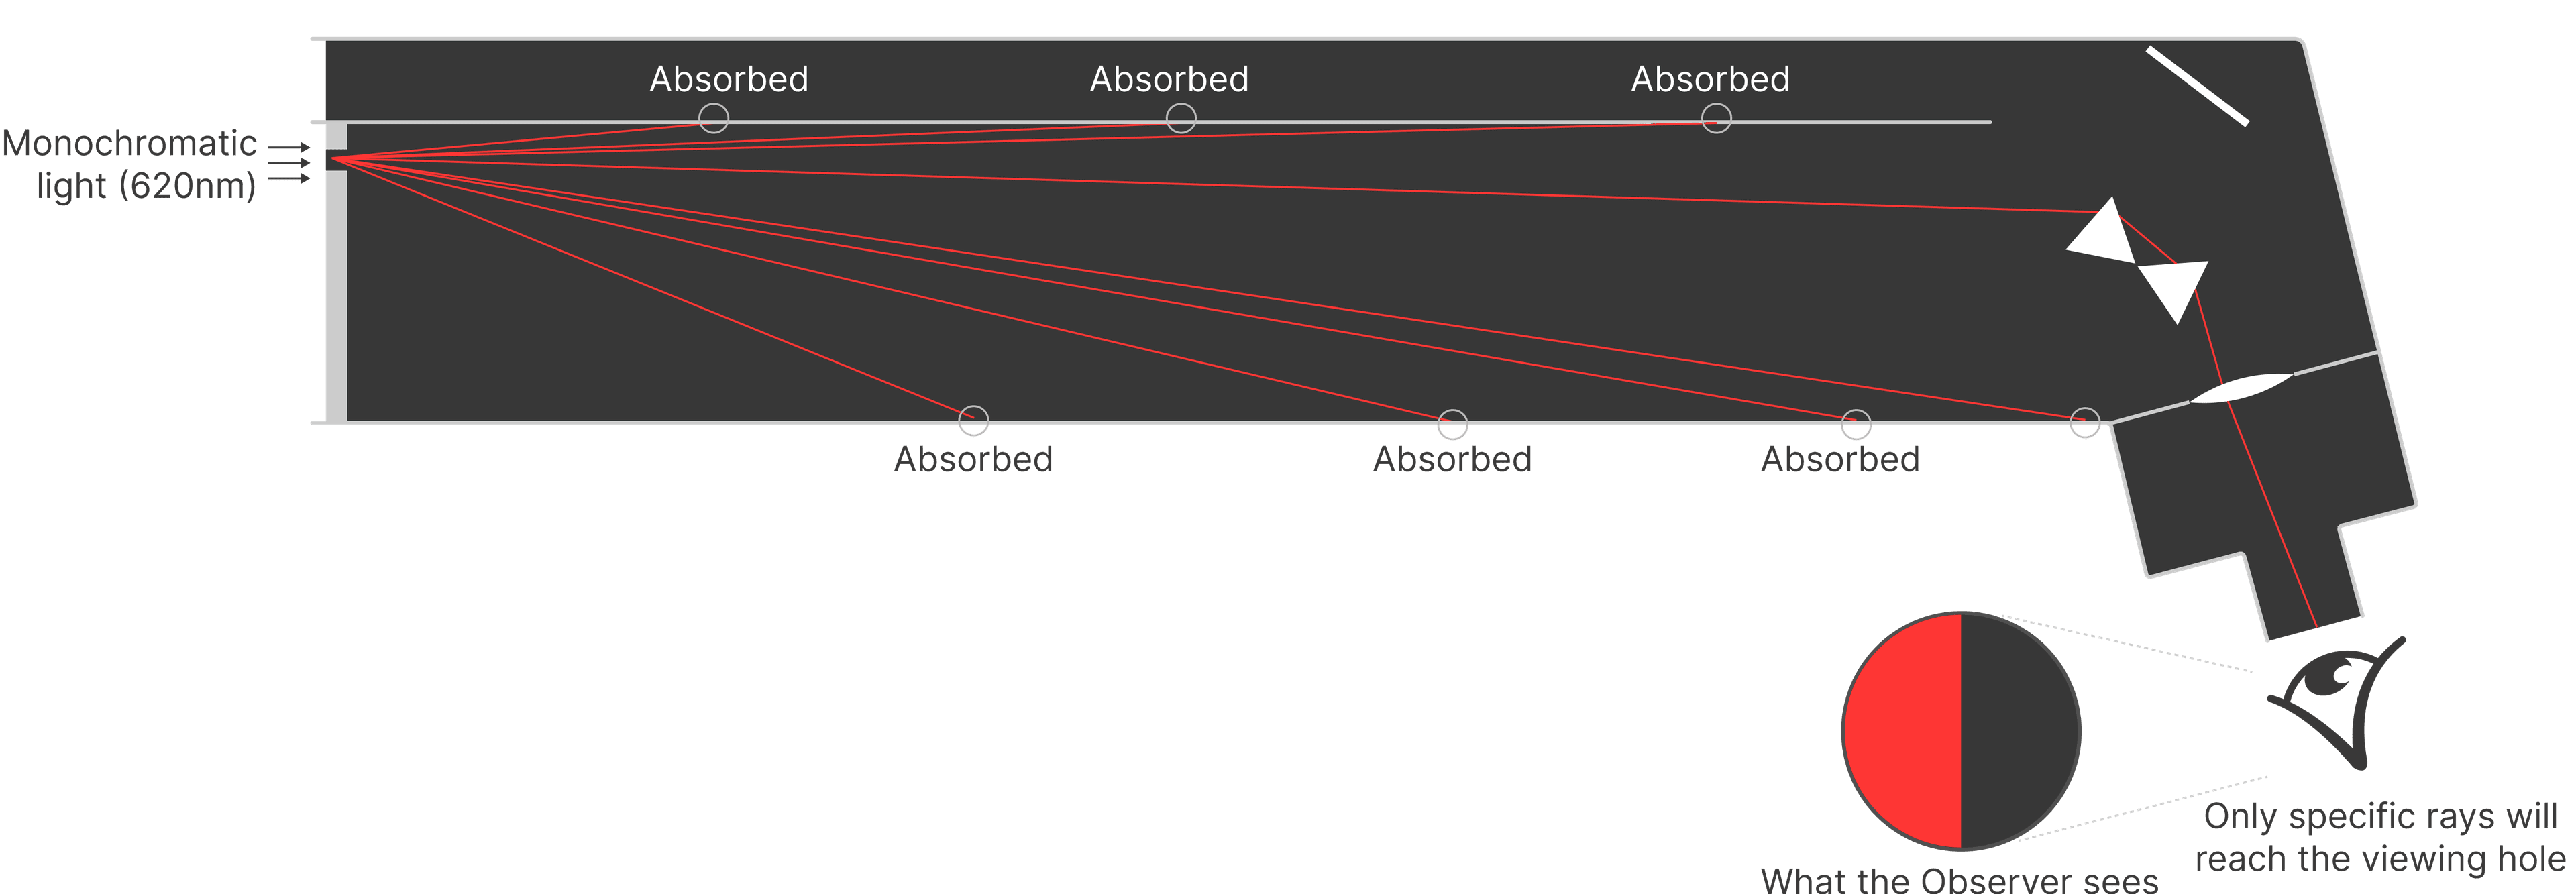
Imagine that we shine light from the other direction. But we will only let a monochromatic light of a specific wavelength, say 620 nm (red light).
As the monochromatic red light enters the inside of the apparatus, only some of the rays will reach the prism. Rays that hit the inner walls of the device will be absorbed, leaving only a tiny set of rays that reach the prism and disperse at the correct angles to get to the viewing hole.
Furthermore, by the time the rays reach the prism, we can assume that they are collimated — parallel to each other — as they travel quite a distance through the tool.
When the viewer looks through the hole, they see half of it illuminated in red. This is because the prism fills only half the viewing hole with color.
The next step is where the magic begins.
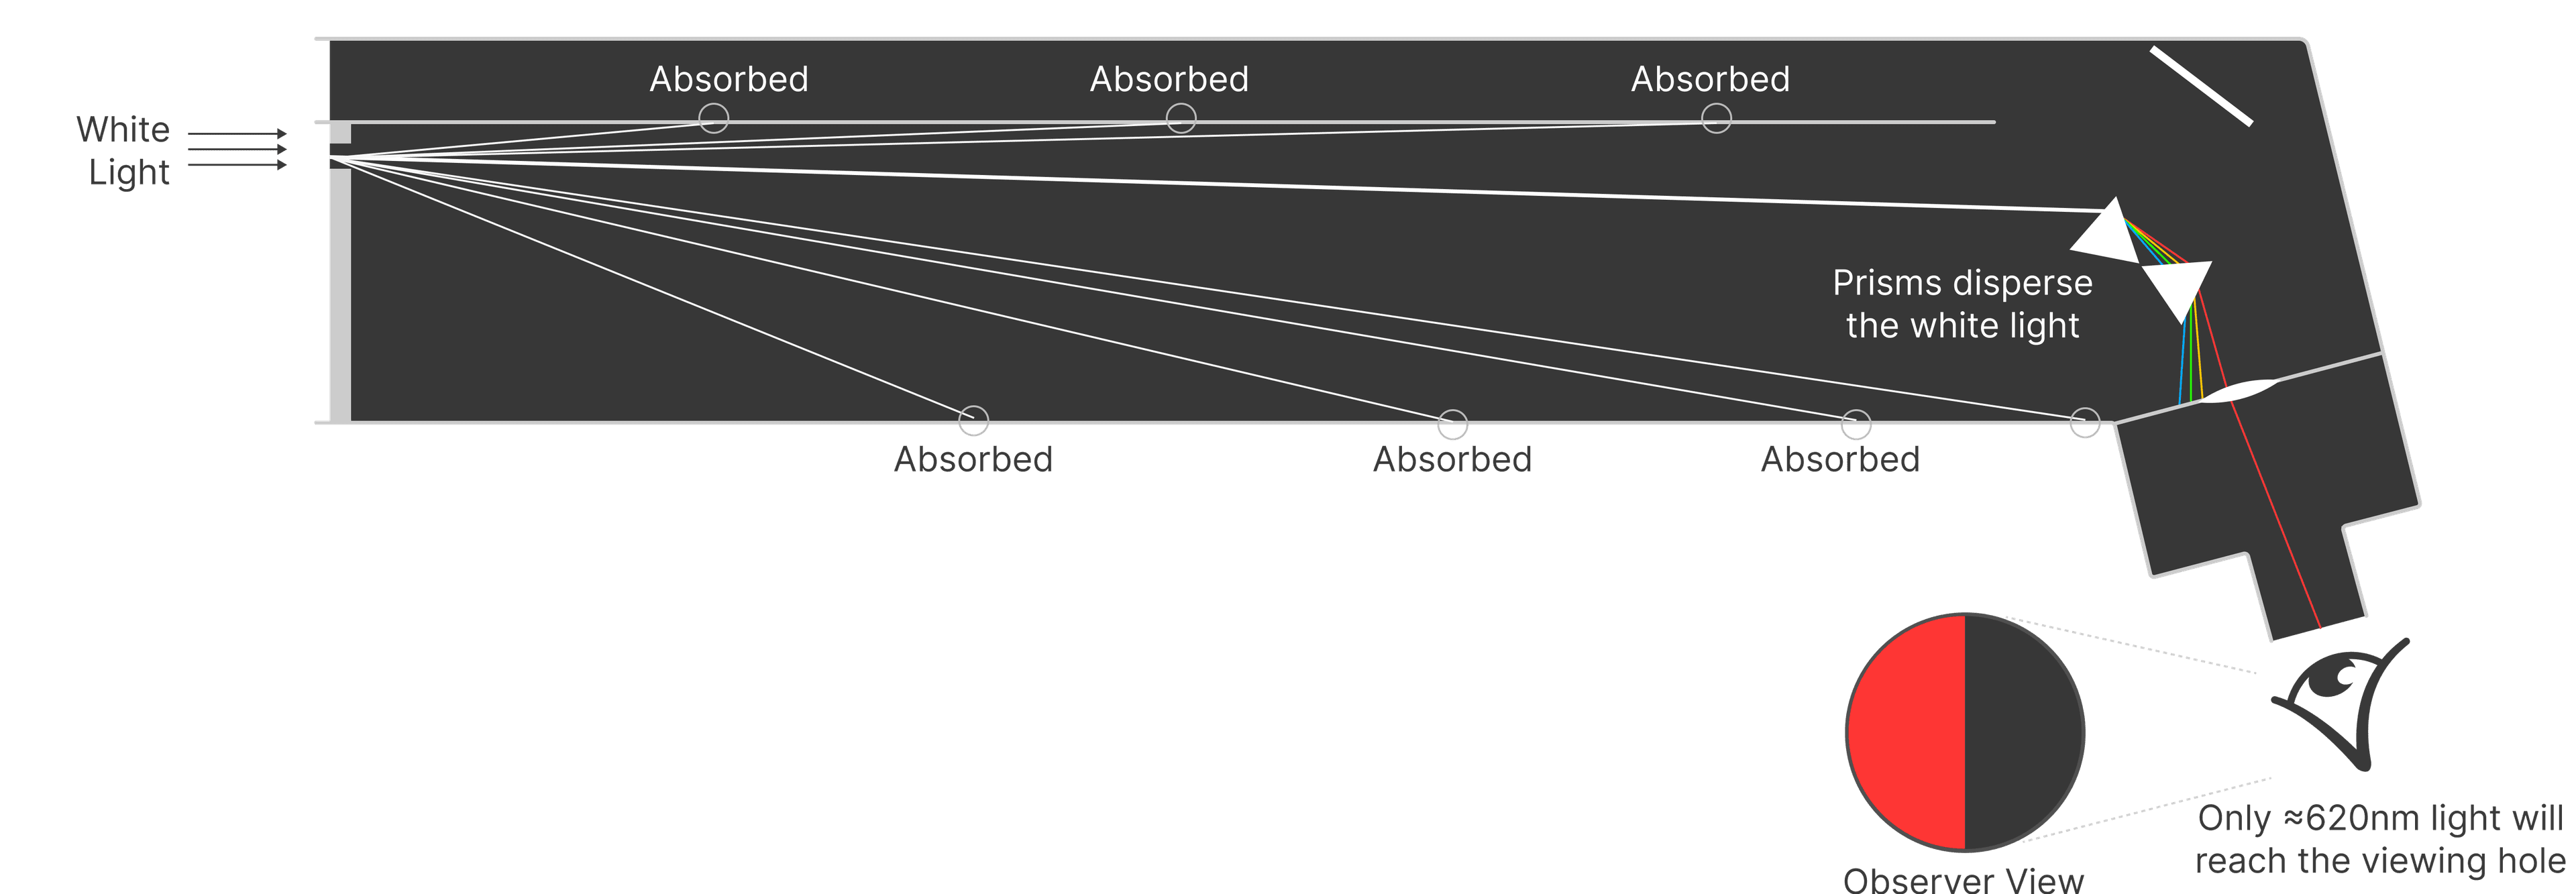
Now, imagine what would happen if you replaced the monochromatic light with a white light. Similar to when we only shined red light, only a specific subset of the rays will reach the prisms. But now, the prisms will disperse the white light into a pure spectrum.
Further more, since the different wavelengths of light get refracted at different angles, from this slit position, only light with a wavelength of around ≈620 nm will reach the viewing hole.
Even though we put in white light, the color that the viewer sees is essentially the same as when we only shined the monochromatic 620 nm (red light) light in.
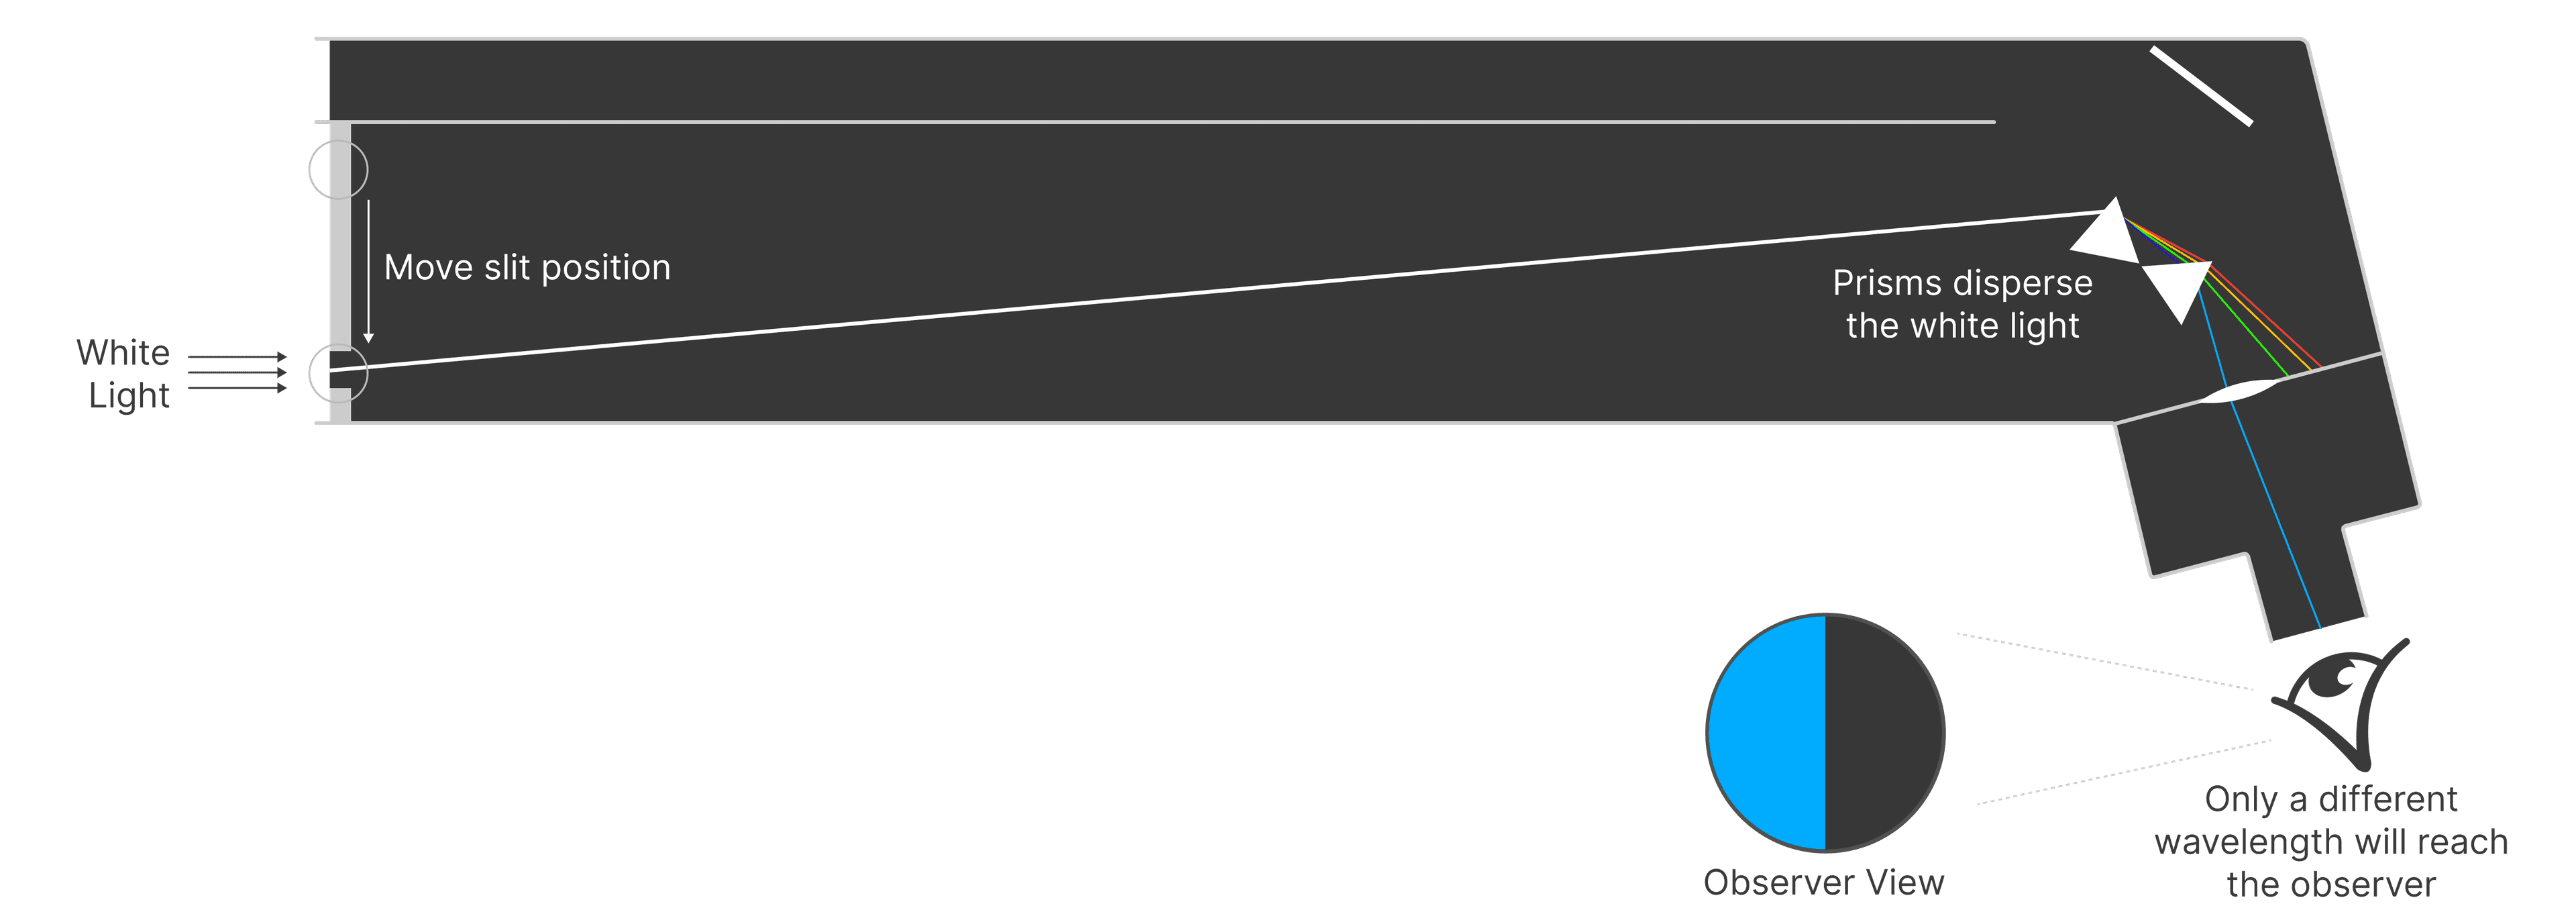
If we moved the position of the slit now, only a different set of wavelengths of light would reach the observer. The light that reaches the observer roughly corresponds to the same color of the pure spectrum formed when we shined white light from the viewing hole.
Finally, we also shine white light into the top section of the apparatus. The white light gets reflected by the mirror and creates a white color on the right side of the image that the viewer sees.
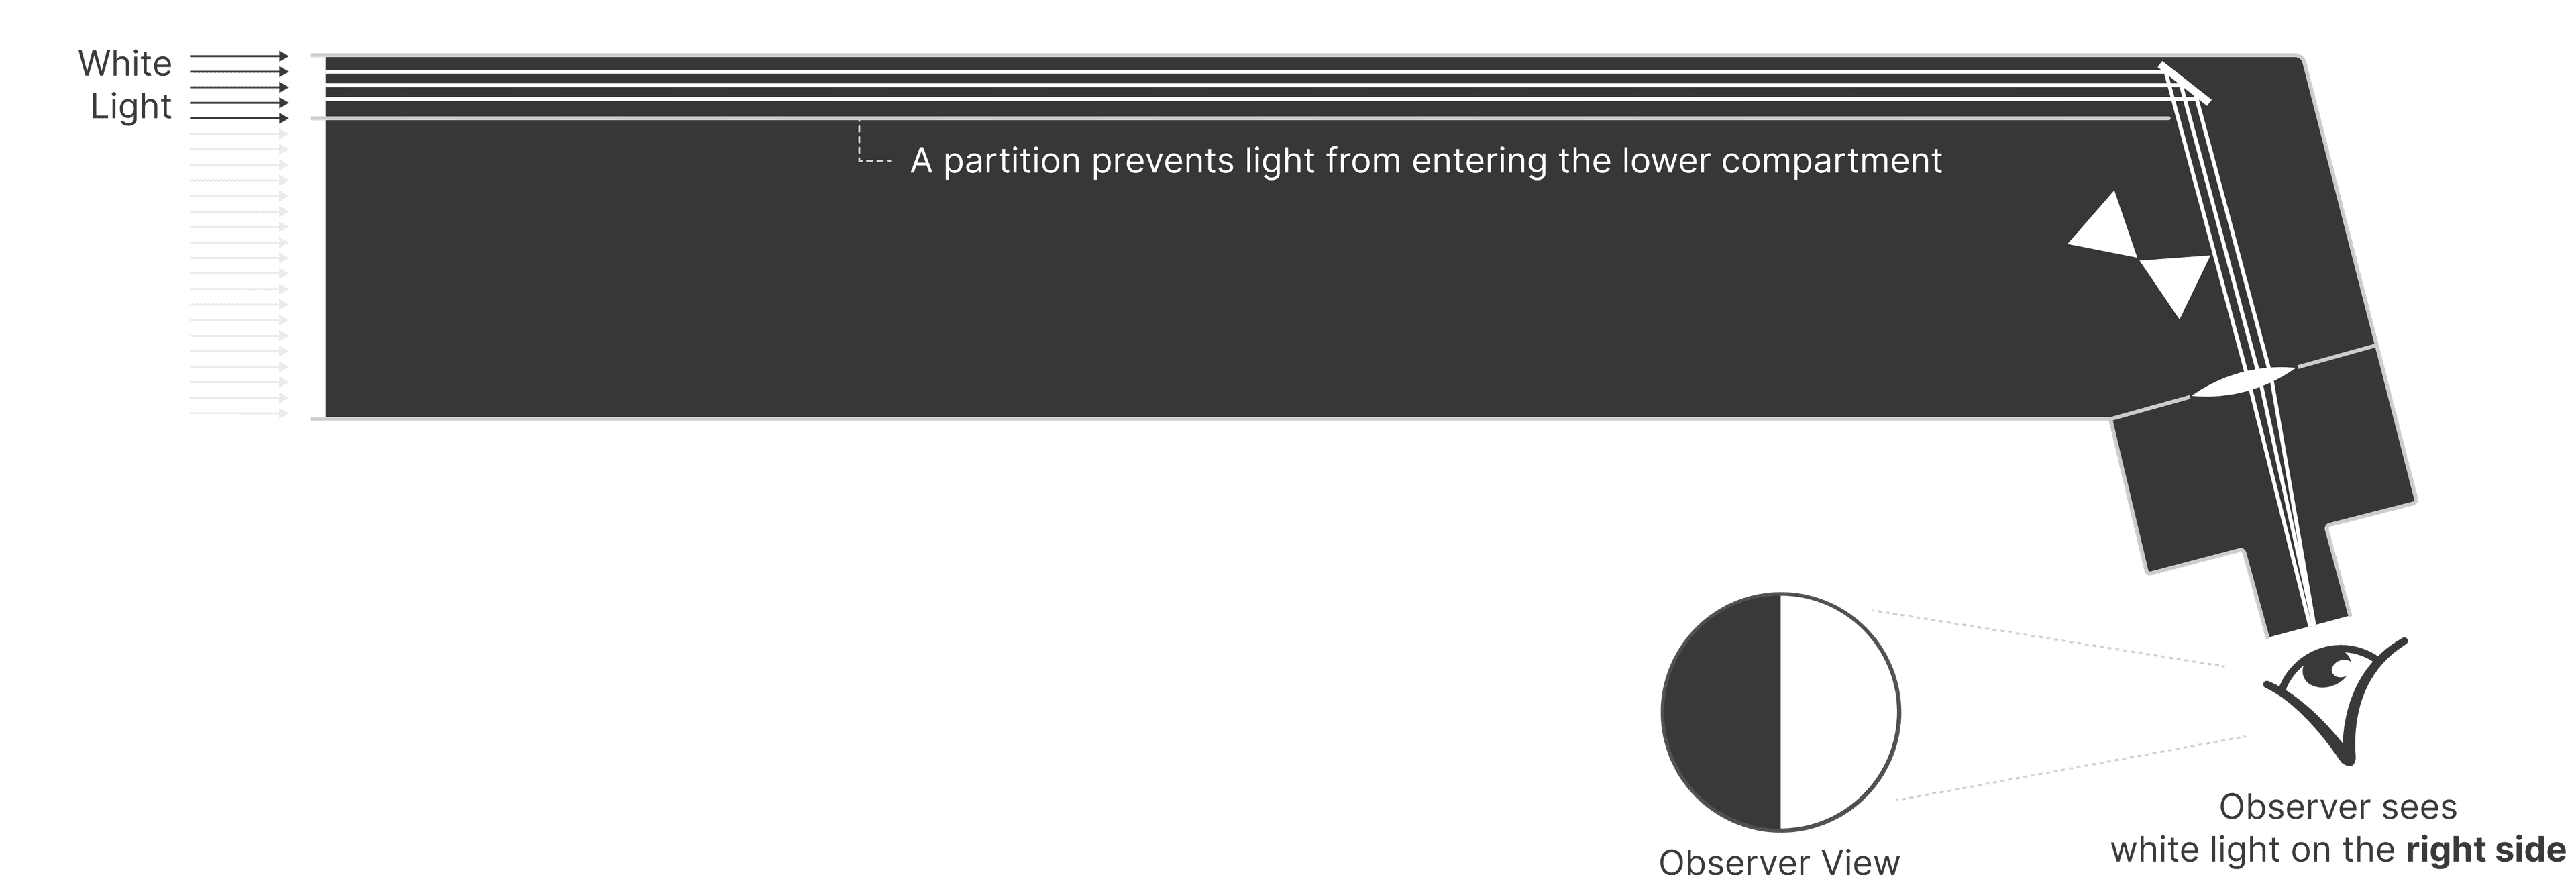
In the final setup, Maxwell had three slits created that let in light at three different positions. Since only roughly specific wavelengths reach the observer from each position, Maxwell could create different combinations of colors by combining three distinct wavelengths.
The width of each slit was also adjustable while keeping the center of the slit fixed. Widening and narrowing the slit width would allow Maxwell to control the intensity of a given color.
Although, strictly speaking, widening slit width could increase the range of wavelengths that reach the observer, in our experiment, we will assume that this setup allows us to select specific wavelengths for the viewer to see. Effectively each slit creates a roughly monochromatic light for our experiment.
By changing the position of the slits and the width of the slits, Maxwell was able to create different colors on one half of the viewing hole.

From now on, in our diagrams, we will add colors to the white light that comes in so that it is easier for us to know which color the slit positions correspond to.

Now we're set! You now know all the essential parts of the tool Maxwell created for his experiment.
The Experiment
Each round will have three different slit positions, which are called primaries. For now, the slits are set at Scarlet (620nm), Green (515nm), and Blue (445nm), each with a width of 30.
You can change both the slit positions and the slit widths by moving the sliders. The viewer sees a different color through the viewing hole by changing these parameters.
30 620nm | + | 30 515nm | + | 30 440nm | = |
By adjusting the width of these three slits (hence adjusting the intensity of the three primaries), Maxwell found the right mix of light to match the target color, white.
The observer should adjust the slits until they are unable to distinguish the color on the left and right sides they see through the viewing hole.
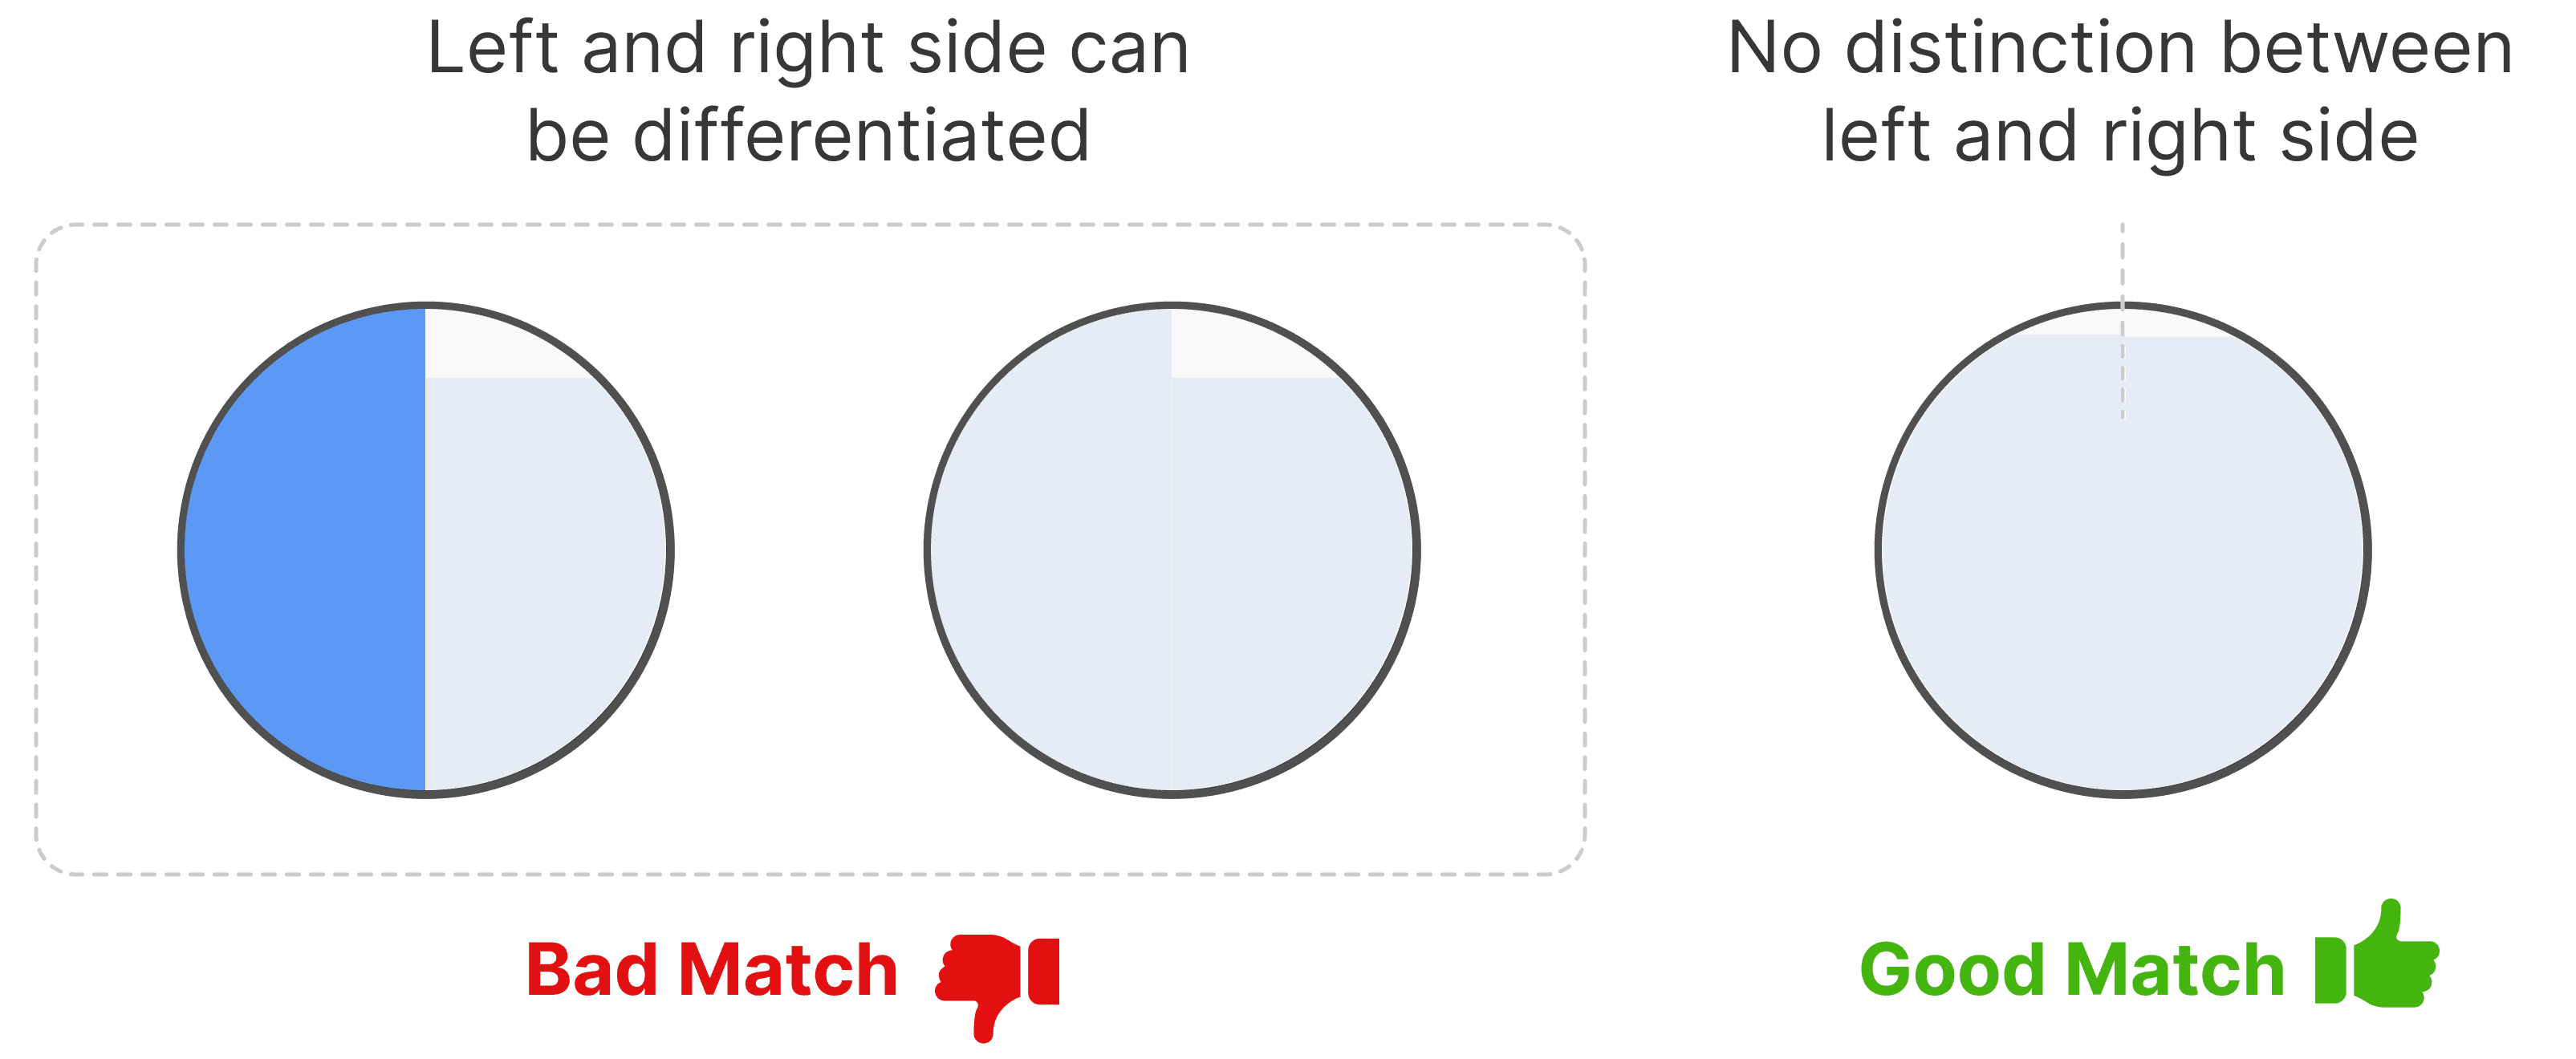
First, try matching the left side of the view to the right side using the primaries Red (620nm), Green (515nm), Blue (445nm).
The slit positions have been locked so the match needs to be created only by changing the ratio of between the three primaries.
Try adjusting the slit widths until you can't tell the difference between the left and right sides of the observer view.
30 620nm | + | 30 515nm | + | 30 445nm | = |
Now, we will change one of these three primaries.
We will replace Blue (445nm) with Greenish-Blue (475nm).
Once again, try matching the left side of the view to the right side using a different set of primaries Red (620nm), Green (515nm), and Greenish-Blue (475nm).
Note that the target color (white) is still identical.
30 620nm | + | 30 515nm | + | 30 475nm | = |
Once again, we will change one of these three primaries.
From the orignal set of Red (620nm), Green (515nm), Blue (445nm). will replace Red (620nm), with Orange (595nm).
Once again, try creating a match but with the primaries Orange (595nm), Green (515nm), and Blue (445nm).
Note that the target color (white) is still identical.
30 595nm | + | 30 515nm | + | 30 445nm | = |
Through the rounds above, you were able to create the same target color white with different sets of three primaries.
30 620nm | + | 30 515nm | + | 30 445nm | = |
30 620nm | + | 30 515nm | + | 30 475nm | = |
30 595nm | + | 30 515nm | + | 30 445nm | = |
If you were able to successfully create matches, we see a two fascinating things emerge.
- We were able to create the same target white color with a different combination of primaries.
- Each set of three primaries required a slightly different amount of each color.
Maxwell continued running 12 rounds of this experiment. In each round, he kept two primaries identical while changing one. He kept two of the three of the following primaries Red (620nm), Green (515nm), Blue (445nm) in all rounds of the experiment.
The target color remained the same white throughout all rounds.
Maxwell's Results
The following were Maxwell's results of running the experiment 12 times. In each round, he changed one of the primaries.
| Slit 1 | Slit 2 | Slit 3 | Target | |||
|---|---|---|---|---|---|---|
18.6 620nm | + | 31.4 515nm | + | 30.5 445nm | = | |
18.3 620nm | + | 33.2 515nm | + | 63.7 420nm* | = | |
17.5 620nm | + | 30.7 515nm | + | 44 440nm* | = | |
18 620nm | + | 31.2 515nm | + | 32.3 440nm* | = | |
19.7 620nm | + | 30.3 515nm | + | 33.7 455nm* | = | |
20.5 620nm | + | 23.7 515nm | + | 40.5 465nm* | = | |
21.7 620nm | + | 10.4 515nm | + | 61.7 475nm* | = | |
22 620nm | + | 62 490nm* | + | 13 445nm | = | |
21.2 620nm | + | 41.4 495nm* | + | 27 445nm | = | |
15.3 620nm | + | 26 535nm* | + | 31.3 445nm | = | |
6.4 620nm | + | 25.2 550nm* | + | 31.3 445nm | = | |
22 570nm* | + | 12.1 515nm | + | 30.6 445nm | = | |
16.1 595nm* | + | 25.6 515nm | + | 30.6 445nm | = | |
44.3 650nm* | + | 31 515nm | + | 27.7 445nm | = |
Wavelengths with * indicate the primary that Maxwell altered for the round.
Maxwell then reexpressed each of these colors in terms of the three primaries he used throughout all rounds, Red (620nm), Green (515nm), Blue (445nm) . The math is simple algebra, but described below for clarity.
For example, in the round in which he changed the red primary to orange, he got:

With red he got:

Since they are both equal white, we can make the two equations equal.

...and make the equation equal to Orange (595nm).


Finally, the figures were normalized so the variable primary was normalized to 1.

Maxwell rewrote all of the colors in terms of the three consistent primaries.
Primary 1 620nm | Primary 2 515nm | Primary 3 445nm | ||||
|---|---|---|---|---|---|---|
0 | + | (-0.03) | + | 0.48 | = | ≈ 420 nm |
0.03 | + | 0.02 | + | 0.69 | = | ≈ 440 nm |
0.02 | + | 0.01 | + | 0.94 | = | ≈ 440 nm |
0.03 | + | 0.03 | + | 0.91 | = | ≈ 455 nm |
(-0.05) | + | 0.19 | + | 0.75 | = | ≈ 465 nm |
(-0.05) | + | 0.34 | + | 0.49 | = | ≈ 475 nm |
(-0.05) | + | 0.51 | + | 0.28 | = | ≈ 490 nm |
(-0.06) | + | 0.76 | + | 0.08 | = | ≈ 495 nm |
0.13 | + | 1.21 | + | (-0.01) | = | ≈ 535 nm |
0.48 | + | 1.25 | + | (-0.03) | = | ≈ 550 nm |
0.85 | + | 0.88 | + | 0 | = | ≈ 570 nm |
1.16 | + | 0.36 | + | (-0.01) | = | ≈ 595 nm |
0.42 | + | 0.01 | + | 0.06 | = | ≈ 650 nm |
0.42 | + | 0.01 | + | 0.06 | = | ≈ 650 nm |
Plotting the figures above onto a chart looks like the following. We see that Maxwell proved that given three primaries, we can reproduce a full range of colors — the Trichromatic theory! Our eyes and brains can perceive a range of colors as a combination of just three colors.
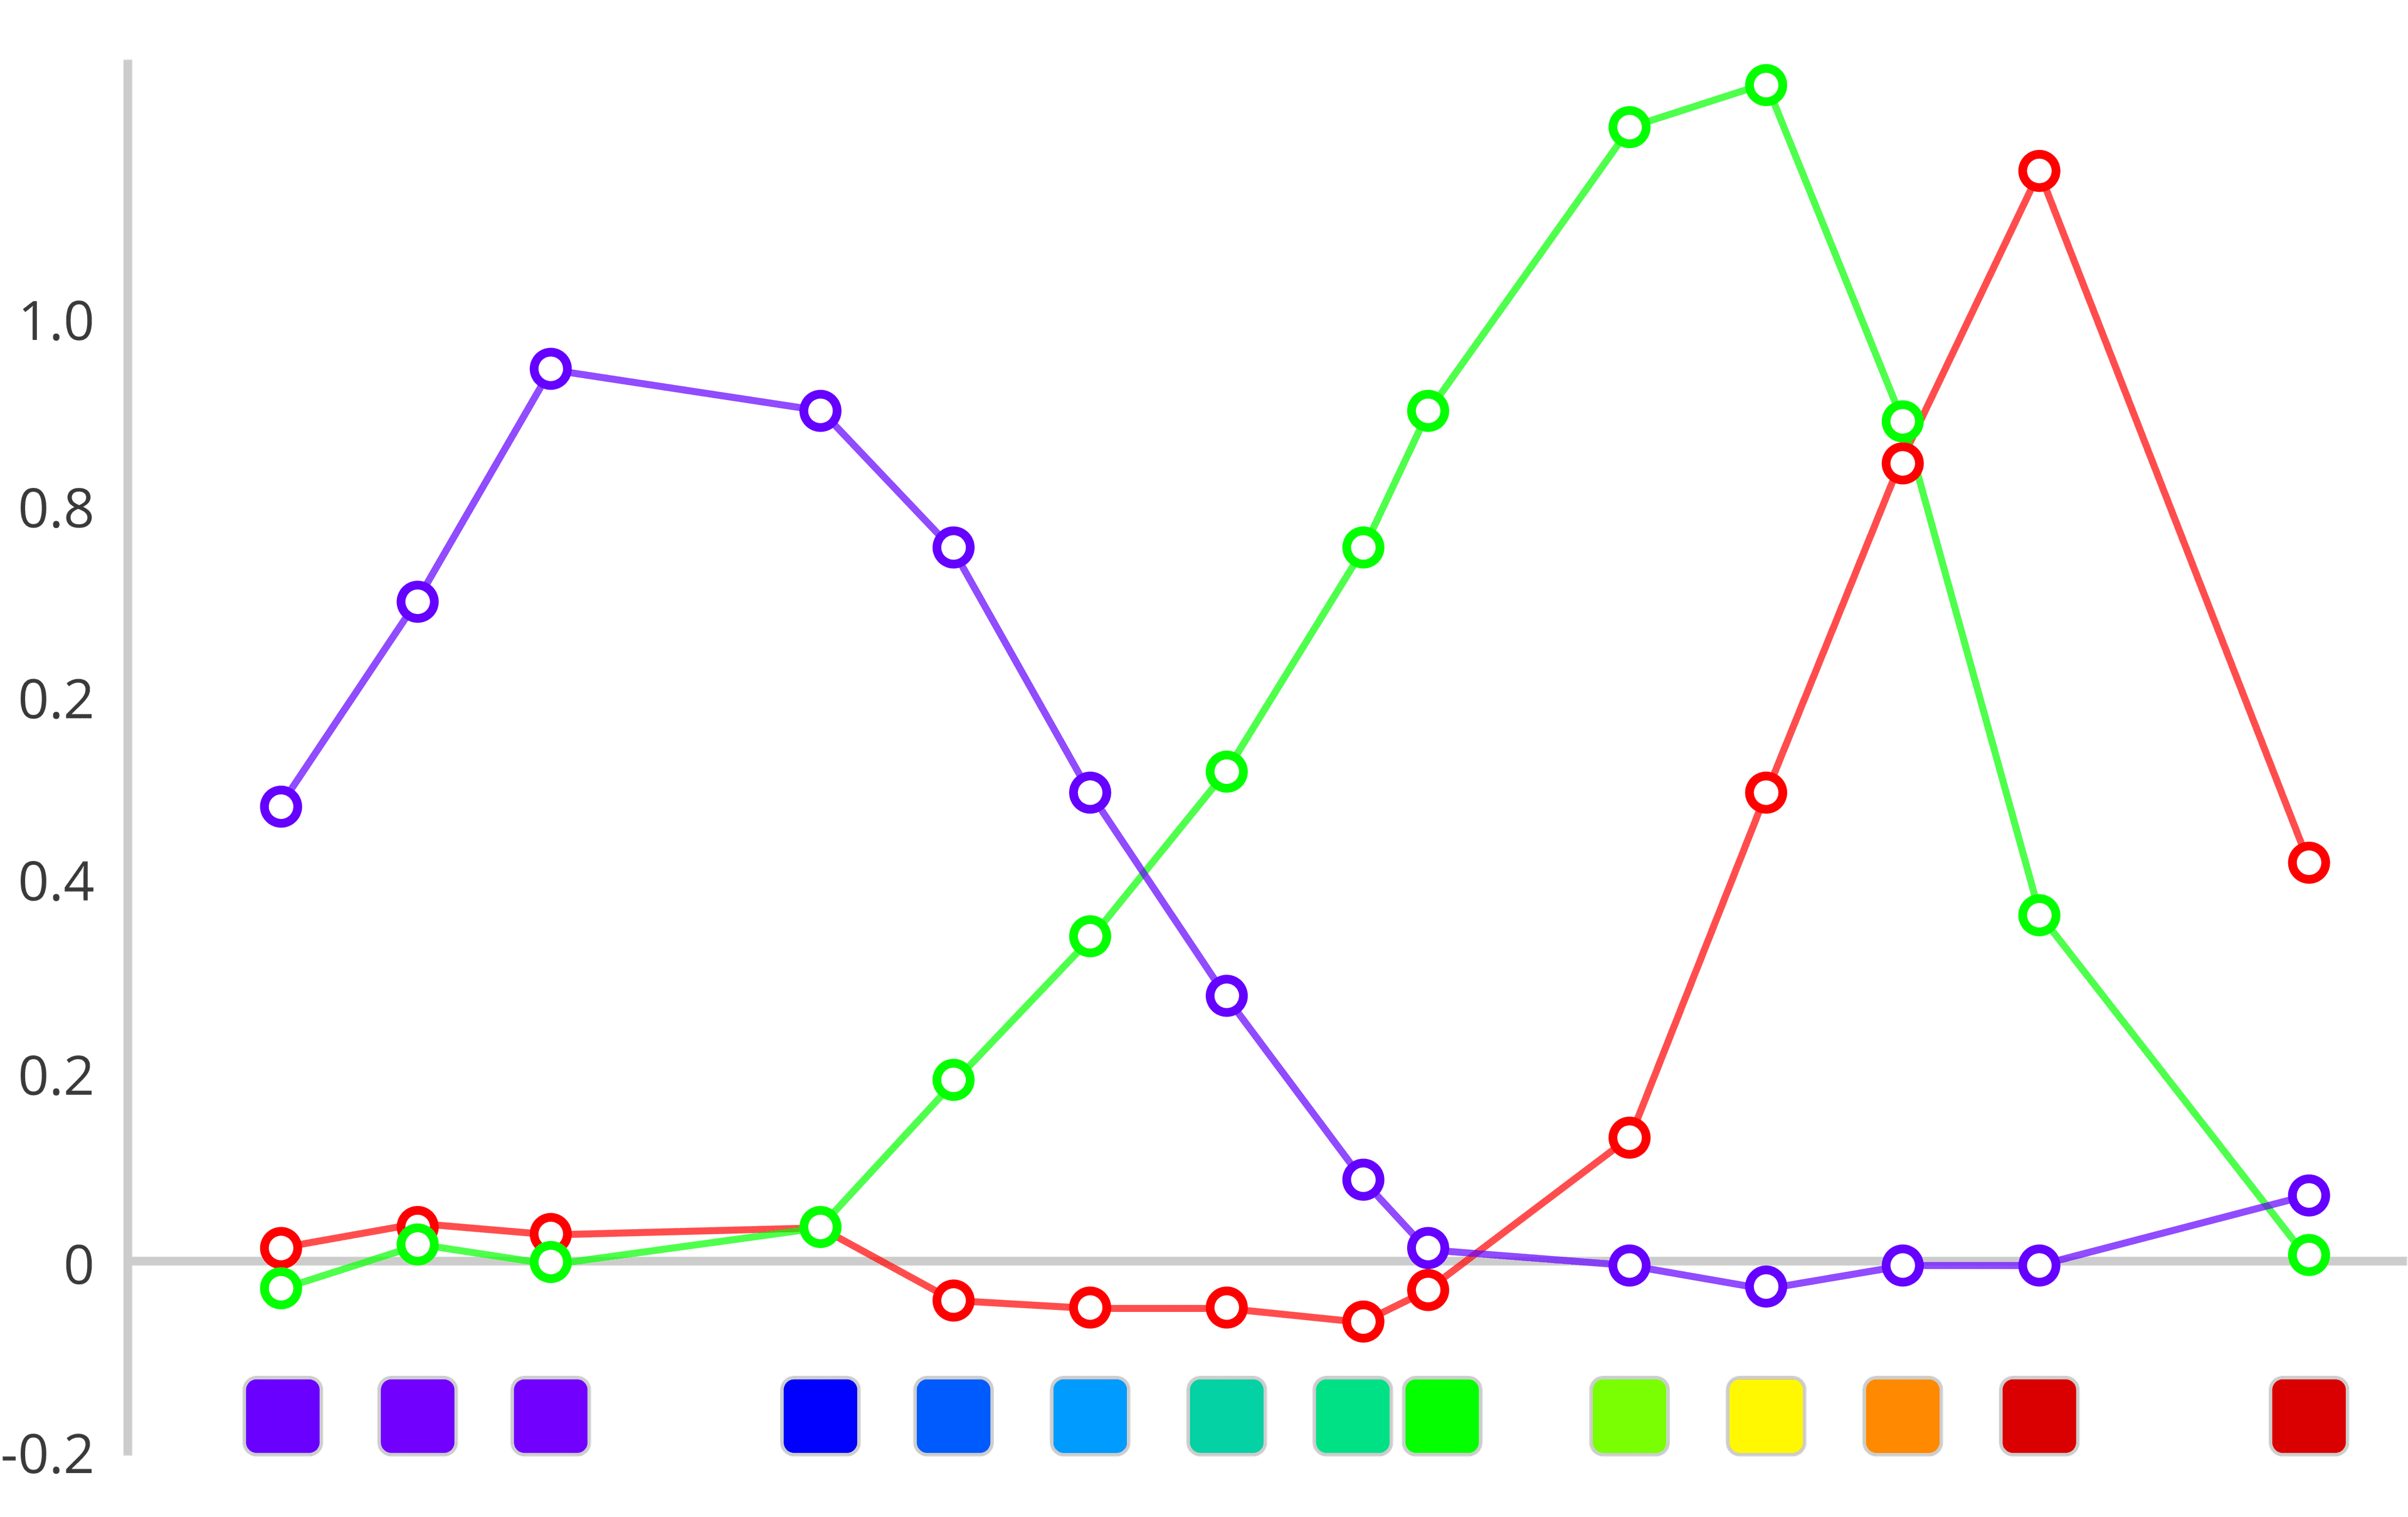
Using this chart, we know the formula for "recreating" a spectrum of colors using just a set of three primaries. Even the colors not directly measured in the experiment can interpolated.
Today, we rely on a chart created by the CIE (International Commission on Illumination) — the CIE 1931 RGB color matching function — which is at the foundation of today's color science. This function was created using high-precision equipment and precise experiments.
What's incredible is how closely Maxwell's experiments resemble the CIE Color Matching Functions! Maxwell was able to do all this using elementary tools.

Although the spotlight of laying the foundations for the trichromatic theory is often given to Thomas Young and Helmhotz, we cannot deny the work that Maxwell had to create the foundations of color science.
End Notes
It's important to note that in the simulation above, there are limitations to the colors that are displayed. Specifically, Maxwell conducted his experiment using colors that cannot be represented on a computer screen (out of gamut). The simulation is intended to give an intuition and understanding of the color matching experiment that Maxwell conducted, but, it is not meant to be an accurate reproduction.
Another limitation to the simulations is that the interaction between the light rays and prisms are not modeled using physics but are innacurate depections for illustative purposes.
The methodology I used to render the colors is to convert the wavelengths to XYZ color space using the wavelength to XYZ table in CIE's Colorimetry Report. In XYZ space, I weigh and sum the colors from the three slit positions. Afterward, the XYZ values are converted into sRGB, and gamma correction is applied. In this web interaction, the RGB values are displayed. Any XYZ values that are out of gamut have been clipped.
Credits
Professor Brian Wandell for all of of our discussions and enthusiasm around Maxwell's experiments, and guiding me through this project from start to finish. It is also Brian's enthusiasm to bring the spotlight to Maxwell for his contributions to the trichromacy theory.
isetfundamentals library for providing the Judd estimates from Maxwell's experiment to nm, as well as for adjusting the Judd estimates by 12nm.
Psych 221: Image Systems Engineering class at Stanford
The Commentary by Qasim Zaidi - Department of Psychology Columbia University New York. New York 10027 was core to understanding Maxwell's original paper
CIE Colorimetry Report - 3rd Edition - Table T.5. CIE 1964 standard colorimetric observer for the wavelength to XYZ conversions
XYZ to sRGB Conversion formulas on Wikipedia for building the simulation